Inflation Calculator
Calculate how inflation affects the purchasing power of money over time. See how much your money is worth in today's terms after adjusting for inflation.
Calculator Settings
PLN
zł 10,000.00
zł 6,120.93
4.79%
63.37%
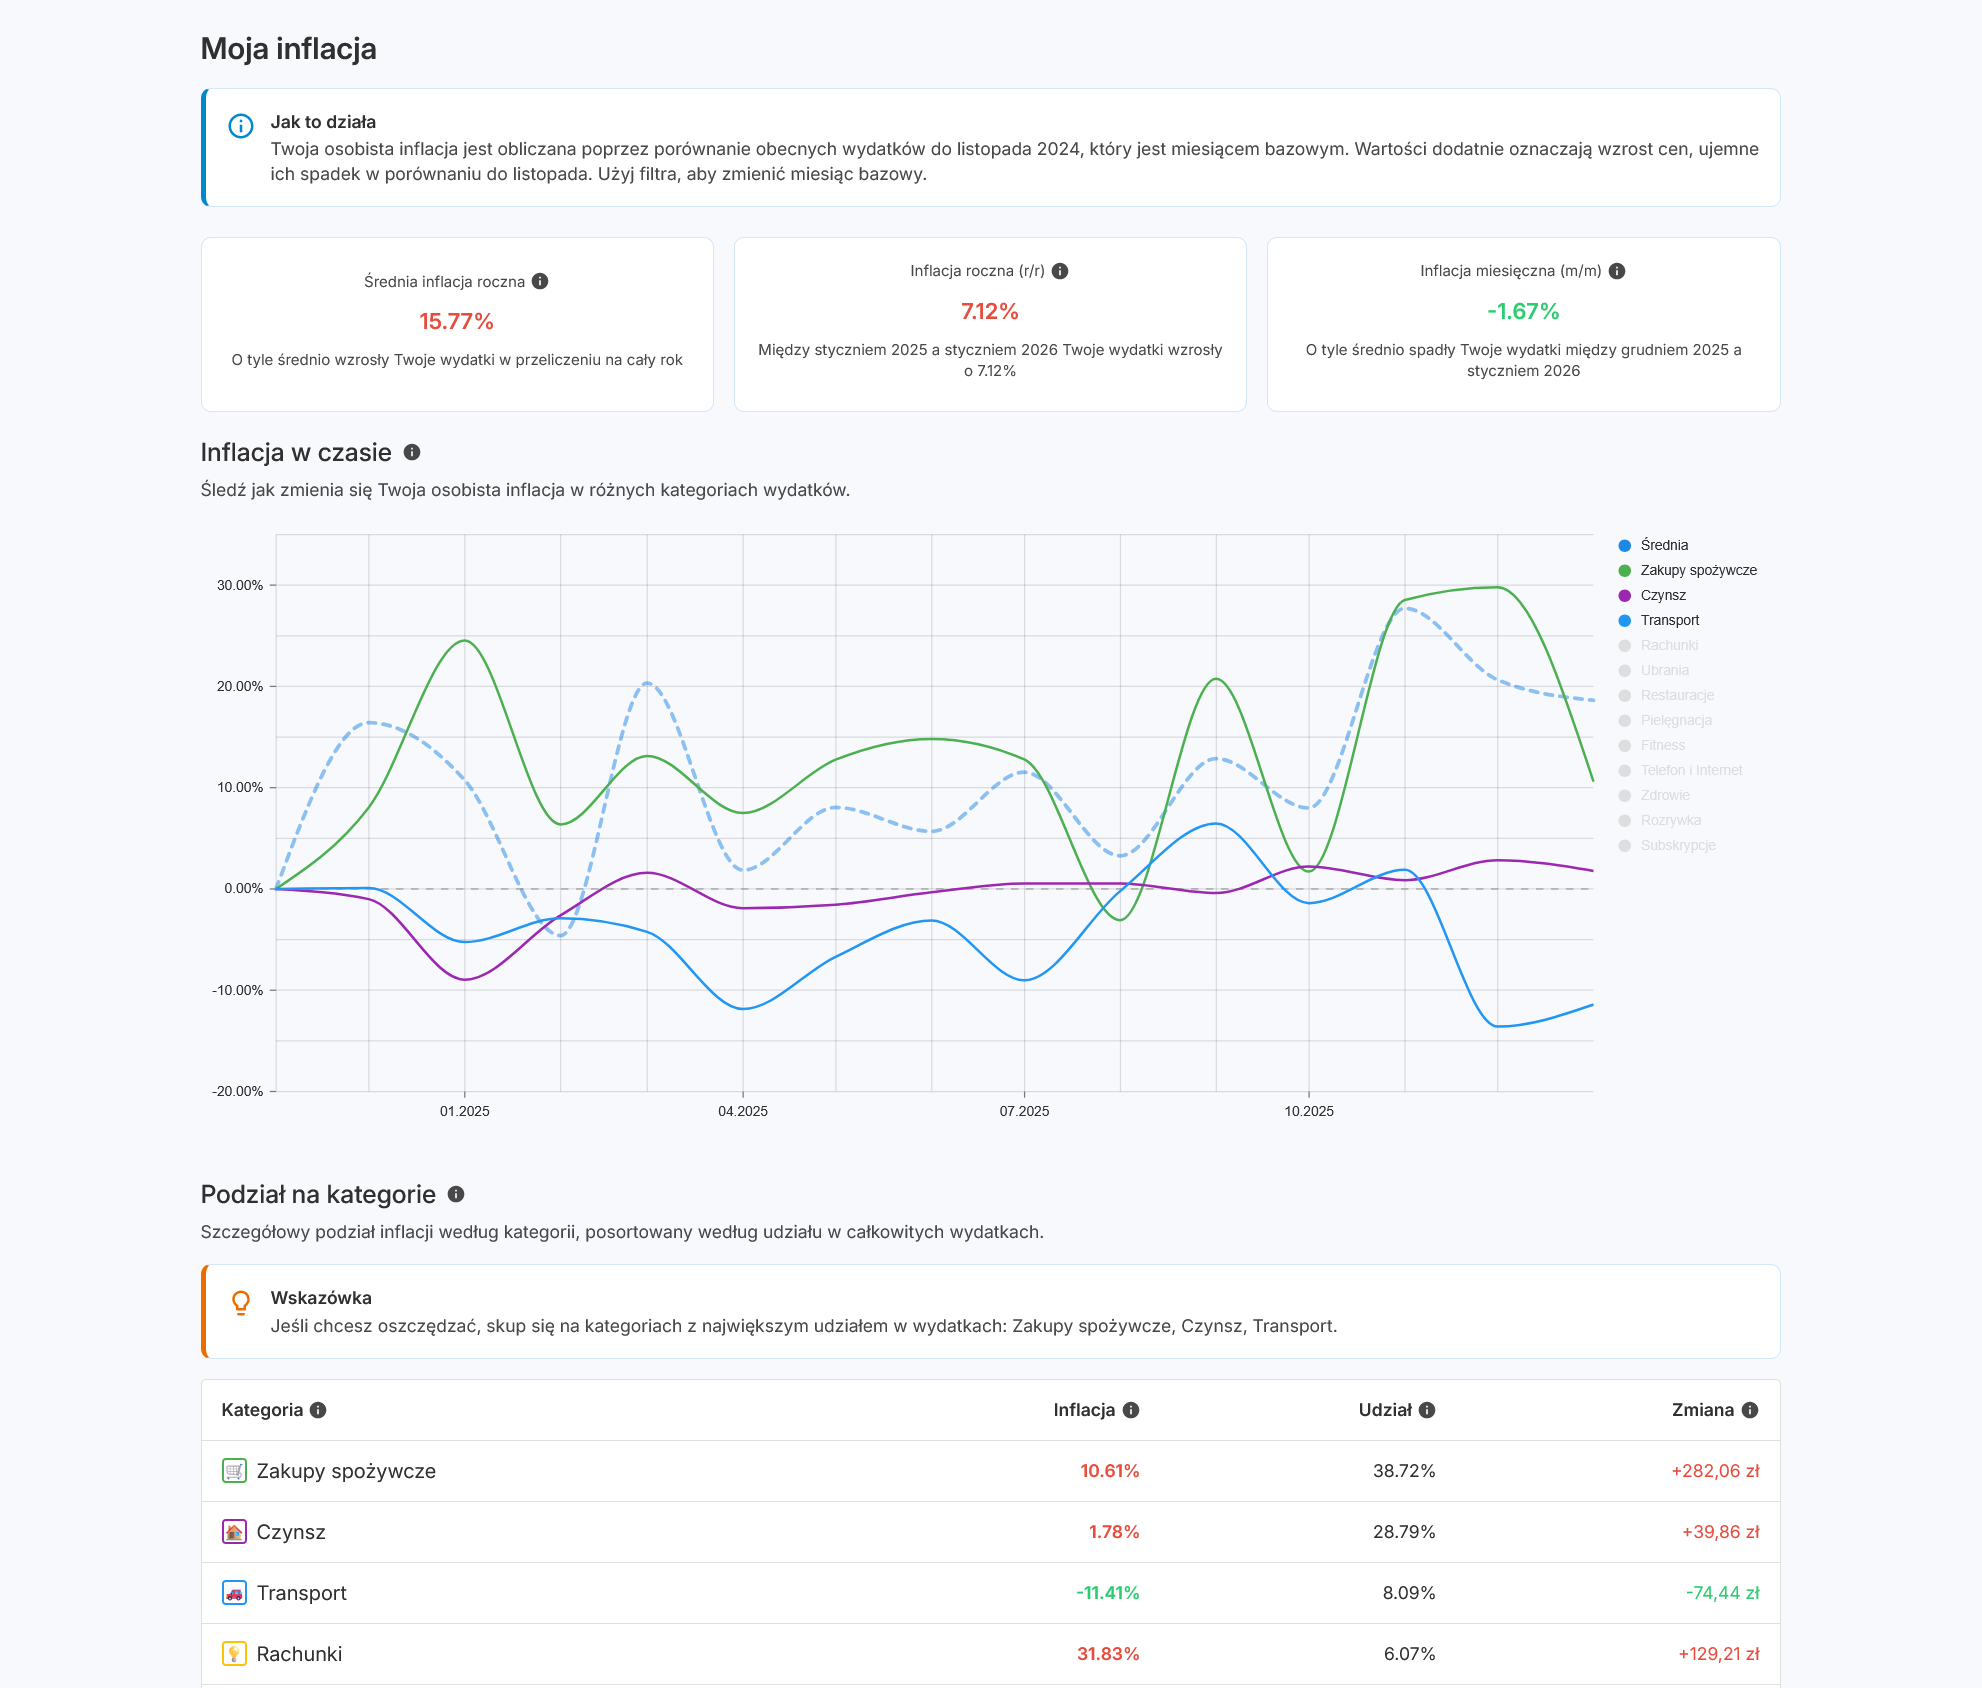
Wpływ inflacji w czasie
Stopa inflacji w danym okresie
The government calculates averages for millions. But what's your real inflation rate?
Discover the truth about your spending that you won't find in government reports.
Create free account and checkYour data is secure • No ads • Free foreverInflation is the process of price changes across the entire economy. It is measured by official statistics and presented in the form of price indices. Inflation most commonly refers to average changes in consumer prices of goods and services purchased by average households. Price indices are also calculated in other areas of the economy, such as agriculture, industry, construction, transport, import and export, wholesale and retail trade, because price changes occurring at every stage of the economic process affect inflation experienced by consumers.
W interpretacji ekonomicznej inflacja (wzrost cen) rozpatrywana z perspektywy gospodarstwa domowego oznacza obniżenie siły nabywczej pieniądza. Na rynku detalicznym oznacza to, że przy niezmienionym dochodzie konsument jest w stanie kupić mniej towarów lub usług.
Personal inflation is the change in prices for spending categories that affect you specifically. Unlike official inflation (calculated for an average household), it reflects your actual spending structure.
How to calculate it:
- Gather your expenses from two periods (e.g., a year ago and now) broken down by categories.
- Calculate what percentage of total expenses each category represents.
- For each category, calculate the percentage change in expenses.
- Multiply the change by the category weight and sum up – this is your personal inflation by categories.
Example calculation by categories:
You compare your expenses from January 2024 with January 2025:
| Category | 2024 | 2025 | Growth | Weight |
|---|---|---|---|---|
| Groceries | zł 1,500.00 | zł 1,680.00 | +12% | 30% |
| Housing | zł 2,000.00 | zł 2,160.00 | +8% | 40% |
| Transport | zł 500.00 | zł 525.00 | +5% | 10% |
| Other | zł 1,000.00 | zł 1,060.00 | +6% | 20% |
| Total | zł 5,000.00 | zł 5,425.00 | 100% |
Calculation: (30% × 12%) + (40% × 8%) + (10% × 5%) + (20% × 6%)
= 3.6% + 3.2% + 0.5% + 1.2%
Twoja inflacja osobista: 8,5%
Gdybyś nie podzielił na kategorie, tylko porównał sumę (zł 5,000.00 vs zł 5,425.00), otrzymałbyś ogólny wzrost +8,5% - ale nie wiedziałbyś, które kategorie najbardziej wpływają na Twoją inflację.
If you spend more on categories growing faster (e.g., energy, groceries), your inflation will be higher than official.
Jak Portfelik może pomóc? Po zarejestrowaniu automatycznie otrzymujesz szczegółowy raport z Twoją osobistą inflacją: śledź inflację miesiąc do miesiąca (m/m) i rok do roku (r/r), zobacz rozbicie na każdą kategorię wydatków, analizuj trendy na interaktywnych wykresach, i otrzymuj wskazówki, które kategorie najbardziej wpływają na Twój budżet.
Zastanawiasz się nad ochroną kapitału? Sprawdź kalkulator obligacji skarbowych, aby porównać opcje ochrony siły nabywczej.
Lifestyle inflation is a phenomenon where your expenses grow along with income – not because of rising prices, but through changed buying habits and raised living standards. In other words: you earn more, so you spend more on better or more expensive things.
Przykłady inflacji stylu życia:
- Previously you made coffee at home, now daily at a café
- Instead of flying economy, you choose business class
- You buy more expensive clothing brands, though cheaper ones served their purpose
- You replace your old car with new, even though old one still worked
To calculate lifestyle inflation, compare your expenses across different periods, considering both price increases (economic inflation) and changes in your consumer choices.
Example calculation:
You compare your coffee expenses:
| Period | What you buy | Expense |
|---|---|---|
| 2023 | Kawa z domu (250g za zł 25.00 miesięcznie) | zł 25.00 |
| 2025 | Kawa w kawiarni (5 dni × 4 tygodnie × zł 15.00) | zł 300.00 |
| Growth | +1100% |
Of this growth, only a small part (e.g., 5-10%) is actual coffee price inflation. The rest is lifestyle inflation – your conscious decision for greater comfort.
Jak to kontrolować? Śledź swoje wydatki w kategorii i analizuj, które wzrosty wynikają z cen, a które z Twoich wyborów. To pozwala świadomie decydować, na co warto wydać więcej, a gdzie zachować dotychczasowy poziom.
Portfelik w walce z inflacją stylu życia: Porównuj swoje wydatki rok do roku w każdej kategorii - aplikacja automatycznie pokazuje, które kategorie rosną najszybciej. Ustaw budżety na wybrane kategorie, a Portfelik ostrzeże Cię, gdy przekroczysz limit. Dzięki temu świadomie kontrolujesz, gdzie pozwalasz sobie na więcej, a gdzie utrzymujesz stały poziom.
Lifestyle inflation isn't bad itself – if your income grows faster than expenses, it's a natural effect of improving living standards. The problem arises when expenses grow faster than income or when you start living beyond your means.
Chcesz osiągnąć niezależność finansową? kalkulator FIRE pokaże, jak kontrolowanie inflacji stylu życia dziś wpływa na wcześniejszą emeryturę.
An inflation raise is a salary increase that compensates for purchasing power loss caused by inflation. You can calculate the inflation rate using the calculator above – just enter your last raise date and today's date.
Wzór:
New salary = Current salary × (1 + inflation rate)
Example calculation:
Twoje obecne wynagrodzenie to zł 8,000.00 brutto. Ostatnia podwyżka była w grudniu 2023. Według kalkulatora, inflacja od grudnia 2023 do grudnia 2024 wyniosła 4,79%.
| Current salary | zł 8,000.00 |
| Period | December 2023 - December 2024 |
| Inflation rate (GUS) | 4,79% |
| Calculation | zł 8,000.00 × 104.79% = zł 8,383.00 |
| Inflation raise | +zł 383.00 (+4,79%) |
This is the minimum raise needed to maintain the same purchasing power. If you get less (e.g., 3%), your real purchasing power will decrease. If more (e.g., 7%), you'll actually earn more than a year ago.
Uwaga: Oficjalna inflacja to średnia dla całego kraju. Jeśli Twoja inflacja osobista jest wyższa (więcej wydajesz na kategorie, które drożeją szybciej), będziesz potrzebować większej podwyżki, aby zachować ten sam standard życia.
Jak wykorzystać kalkulator powyżej? Wprowadź datę swojej ostatniej podwyżki jako "Data od" i dzisiejszą datę jako "Data do". Kalkulator pokaże Ci dokładną inflację w tym okresie - to Twoja minimalna podwyżka potrzebna do zachowania siły nabywczej.
💡 Negotiation tip:
When preparing for a raise discussion, use specific data. Instead of saying "inflation is high", say: "According to GUS data, inflation from December 2023 was 4.79%. Without a raise by this amount, I'm realistically earning less than back then." A specific number from official data is a strong argument - the employer cannot dispute it.
Inflacja zmniejsza siłę nabywczą odłożonych pieniędzy. Przy obecnych ustawieniach Twoje oszczędności o nominalnej wartości zł 10,000.00 na początku okresu (January 2016) mają na koniec wybranego okresu (June 2026) realną wartość zł 6,120.93.
Różnica wynosi zł 3,879.07 i odpowiada łącznej inflacji 63.37% w analizowanym okresie.
Innymi słowy: za zł 10,000.00 możesz kupić na koniec wybranego okresu (June 2026) tyle samo towarów i usług, co na początku okresu (January 2016) za zł 6,120.93. Jeśli koszyk zakupów wartych zł 6,120.93 na początku okresu (January 2016) kosztuje na koniec wybranego okresu (June 2026) zł 10,000.00, to Twoje pieniądze straciły na sile nabywczej.
The chart above shows how the real value of your funds declines month by month.
Aby pokonać inflację, Twoje oszczędności muszą rosnąć. Użyj kalkulatora procentu składanego, aby sprawdzić, jaki zwrot jest potrzebny do utrzymania lub zwiększenia siły nabywczej.
Średnia roczna inflacja to miara pokazująca średnie tempo wzrostu cen w skali roku w wybranym okresie. Dla okresu od January 2016 do June 2026 średnia roczna inflacja wynosi 4.79%.
Oznacza to, że średnio ceny rosły o 4.79% rocznie w tym okresie. To różni się od łącznej inflacji (63.37%), która pokazuje całkowity wzrost cen w całym analizowanym okresie.
Example:
Jeśli zainwestowałeś pieniądze na początku okresu (January 2016), aby zachować ich siłę nabywczą, Twoja inwestycja musiałaby przynosić co najmniej 4.79% rocznie. Każdy zwrot poniżej tej stopy oznacza, że Twoja realna siła nabywcza zmniejszyła się.
Średnia roczna inflacja jest szczególnie przydatna do porównywania ze zwrotami z inwestycji, wzrostem wynagrodzeń czy planowania długoterminowych celów finansowych. Odpowiada na pytanie: "O ile średnio rocznie rosną ceny?"
Inflation is a rise in the general price level – you buy less with the same money.
Deflation is a fall in prices (rare phenomenon, can slow the economy).
Disinflation means prices are still rising, but more slowly than before – inflation is falling, but still positive.
Stagflation is a combination of high inflation and economic stagnation (low growth, high unemployment) – a particularly difficult situation for households.
Inflacja miesięczna pokazuje zmianę cen w stosunku do poprzedniego miesiąca. Inflacja roczna (r/r, rok do roku) porównuje ceny z tym samym miesiącem rok temu - to najczęściej podawana wartość w mediach. Inflacja roczna wygładza wahania sezonowe (np. wyższe ceny warzyw zimą) i lepiej pokazuje długoterminowy trend.
Not quite. Falling inflation (disinflation) means prices are rising more slowly, but they're still rising. Example: if inflation fell from 10% to 5%, prices are still higher than a year ago, just the pace of increase has slowed.
Important: annual inflation can be positive while prices fall on a monthly basis. Example: if prices fell 0.2% from November 2024 to December 2024, but are still 3% higher than December 2023, then monthly inflation is -0.2% while annual inflation is +3%.
Falling prices over a full year is deflation – a rare phenomenon in modern economies.